📚 Part of our Sourdough Nutrition Guide: Looking at fiber, weight loss, or digestion impact? See the complete nutrition overview →
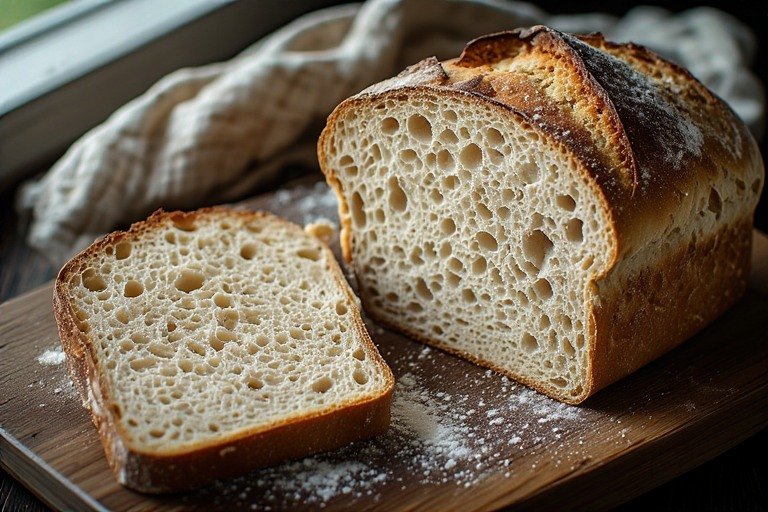
Sourdough Bread Macros: Complete Nutrition & Calorie Breakdown
🎯 Quick Answer
📋 Table of Contents
If you’re tracking your food intake, understanding sourdough bread macros is essential. A standard slice of sourdough bread (about 50g) contains roughly 130–140 calories, 25–27g of carbohydrates, 4–5g of protein, and 0.5–1g of fat. Fiber clocks in at around 1–2g per slice. Compared to many other breads, sourdough’s fermentation process alters how your body processes these macronutrients, making it a smarter choice for people watching their blood sugar, managing weight, or simply trying to eat more intentionally. This guide breaks down everything you need to know about the nutrition and macros in sourdough bread.
Sourdough Bread Macros: The Full Breakdown
The macronutrient profile of sourdough bread depends on the flour type used, the hydration of the dough, and how the bread is sliced. That said, most standard sourdough made from white or bread flour falls within a predictable range. Below is a typical nutritional breakdown per one medium slice (approximately 50g):
| Nutrient | Amount per Slice (50g) | % Daily Value (approx.) |
|---|---|---|
| Calories | 130–140 kcal | 6–7% |
| Total Carbohydrates | 25–27g | 9–10% |
| Dietary Fiber | 1–2g | 4–7% |
| Sugars | 0.5–1g | <1% |
| Protein | 4–5g | 8–10% |
| Total Fat | 0.5–1g | <1% |
| Sodium | 200–280mg | 9–12% |
How Sourdough Macros Compare to Other Breads
When you look at sourdough nutrition and macros side by side with other popular bread options, sourdough consistently stands out — not necessarily for dramatically different numbers, but for the quality of those macros and how the body uses them.
| Bread Type | Calories | Carbs | Protein | Fat | Sugar |
|---|---|---|---|---|---|
| Sourdough (white) | 130–140 | 25–27g | 4–5g | 0.5–1g | 0.5–1g |
| White sandwich bread | 130–150 | 25–28g | 3–4g | 1–2g | 2–4g |
| Whole wheat bread | 110–130 | 20–24g | 4–5g | 1–2g | 2–4g |
| Sourdough (whole wheat) | 120–135 | 22–25g | 5–6g | 0.5–1g | 0.5–1g |
| Rye bread | 80–110 | 15–20g | 3–4g | 1g | 0–1g |
| Ezekiel bread | 80–90 | 15–16g | 4–5g | 0.5–1g | 0g |
| Brioche | 180–220 | 24–28g | 4–5g | 6–10g | 4–8g |
As you can see, sourdough’s fat and sugar content are among the lowest of all common bread types. Its calorie count is comparable to standard white bread, but the fermentation process makes a meaningful difference in how those calories behave in your body — more on that below.
Why the Fermentation Process Changes the Macro Story
Raw numbers only tell part of the story when it comes to sourdough. What makes sourdough nutrition unique is the fermentation process, which fundamentally changes the bioavailability and glycemic impact of those macronutrients.
During bulk fermentation, wild yeast and lactic acid bacteria break down a significant portion of the starch and sugars in the flour. This does two important things:
- Lowers the glycemic index (GI): Sourdough has a GI of roughly 48–54, compared to 70–75 for standard white bread. This means your blood sugar rises more slowly and more moderately after eating sourdough.
- Increases resistant starch: Some of the starches are converted into forms that resist digestion in the small intestine, acting more like fiber than typical carbohydrates. This effect is even more pronounced when sourdough is toasted. Learn more about how toasting sourdough affects its calories and resistant starch content.
Sourdough Macros by Flour Type
Not all sourdough is created equal. The flour used dramatically affects the macronutrient profile, especially the fiber and protein content. Here’s a breakdown of how different flour types shift the numbers:
White Flour Sourdough
This is the most common variety. It has the highest carbohydrate count and the lowest fiber content, but it’s still lower in sugar and fat than most commercial white breads. It also benefits from fermentation-related improvements in glycemic response.
Whole Wheat Sourdough
Whole wheat sourdough offers more fiber (typically 2–4g per slice), more protein, and more micronutrients like magnesium and B vitamins. The bran and germ remain intact, giving it a denser nutritional profile. Sourdough’s fiber content is often underestimated, and whole wheat versions push this even higher.
Rye Sourdough
Rye-based sourdough is the most fiber-rich option, often containing 3–5g of fiber per slice. It also has a lower glycemic response than wheat-based sourdough and is particularly rich in prebiotics that support gut health. The calorie count is generally slightly lower as well.
Spelt Sourdough
Spelt sourdough offers a slightly higher protein content than standard wheat and is easier for some people to digest due to its different gluten structure. Its macros are broadly similar to whole wheat sourdough.
Net Carbs in Sourdough Bread
For those following keto or low-carb diets, understanding net carbs is crucial. Net carbs are calculated by subtracting fiber and certain sugar alcohols from total carbohydrates:
Net Carbs = Total Carbs – Dietary Fiber – Resistant Starch
A standard 50g slice of white sourdough contains:
- Total Carbs: 25-27g
- Dietary Fiber: 1-2g
- Resistant Starch: ~2-3g (increases when toasted)
- Net Carbs: ~20-24g per slice
For whole wheat sourdough:
- Total Carbs: 22-25g
- Dietary Fiber: 2-4g
- Resistant Starch: ~3-4g
- Net Carbs: ~15-19g per slice
While sourdough is not a true low-carb food, the fermentation process does create resistant starch that effectively reduces the glycemic impact. Explore our sourdough keto and low-carb hack for strategies to fit sourdough into a lower-carb lifestyle.
Sourdough Macros and Weight Management
For those tracking calories and macros for weight loss or maintenance, sourdough can be a genuinely useful tool. Its low fat content, minimal added sugars, and moderate protein make it a clean carbohydrate source that fits well into a balanced diet. The lower glycemic index also means better appetite regulation — blood sugar spikes and subsequent crashes are a major driver of overeating, and sourdough helps minimize this cycle.
If you’re exploring how sourdough fits into a weight-management approach, read our comprehensive guide on sourdough and weight loss for detailed strategies.
That said, sourdough is not a low-carb food. A single slice contains 25–27g of carbohydrates, which is significant for anyone following a strict low-carb or ketogenic diet. However, when you factor in resistant starch — which doesn’t spike blood sugar and behaves more like fiber — the effective net carbs may be lower than the label suggests.
Sourdough Nutrition Macros: Micronutrients Worth Noting
While macros get most of the attention in food tracking, sourdough also delivers a meaningful micronutrient payload. The fermentation process improves mineral bioavailability by breaking down phytic acid — an antinutrient found in grains that normally binds to minerals and prevents their absorption.
Key micronutrients in sourdough include:
- Iron: 5–10% DV per slice, with better absorption than in non-fermented bread
- Magnesium: 4–6% DV, important for muscle function and blood sugar regulation
- Selenium: A meaningful source, supporting thyroid function and antioxidant activity
- B vitamins (B1, B3, folate): Present in moderate amounts, supporting energy metabolism
- Manganese: Supports bone health and enzyme function
These benefits are even more pronounced in whole grain sourdough varieties. The overall nutritional case for sourdough goes well beyond just its macros. For a complete picture, read our full review: Is sourdough bread healthy?
How to Fit Sourdough Macros Into Your Daily Targets
If you’re working with specific macro targets — whether for muscle building, fat loss, or general health — here’s how sourdough fits into common dietary frameworks:
Standard Balanced Diet (2,000 calories)
Two slices of sourdough provide roughly 260–280 calories, 50–54g of carbs, 8–10g of protein, and under 2g of fat. This fits comfortably as part of a lunch or breakfast without using up excessive macro budget.
High-Protein Diet
Sourdough’s protein content (4–5g per slice) is moderate, not high. If you’re targeting 150–200g of protein per day, sourdough won’t move the needle dramatically, but it contributes consistently. Pairing it with eggs, cheese, or smoked salmon maximizes protein per meal.
Low-Fat Diet
With under 1g of fat per slice, sourdough is an excellent low-fat carbohydrate source. It fits well into low-fat dietary patterns without requiring any modification or trimming.
Lower-Carb Approach
If you’re moderating carbohydrates rather than eliminating them, one slice of sourdough (25–27g carbs) can fit into a 100–150g daily carb target. Choosing whole wheat or rye sourdough and toasting it will increase resistant starch, effectively reducing the glycemic impact of those carbs.
How to Calculate Macros for Homemade Sourdough
If you’re making sourdough at home, calculating precise macros requires accounting for ingredient weights and baking loss. Here’s a step-by-step method:
Step 1: List All Ingredients with Weights
For a basic sourdough loaf, you’ll need:
- Flour (typically 500g)
- Water (typically 350g for 70% hydration)
- Sourdough starter (typically 100g)
- Salt (typically 10g)
Step 2: Use a Nutrition Calculator
Enter all ingredients into a recipe analyzer tool like:
- MyFitnessPal Recipe Calculator
- HappyForks Recipe Analyzer
- USDA FoodData Central
This will give you the total macros for the entire unbaked dough.
Step 3: Account for Baking Loss
Sourdough loses 15-20% of its weight during baking as water evaporates. For accurate macros:
- Weigh your dough before baking (e.g., 960g)
- Weigh the cooled loaf after baking (e.g., 800g)
- Divide total macros by the final weight to get macros per gram
- Weigh each slice to calculate per-slice macros
Example Calculation
Recipe totals (pre-bake):
- Calories: 2,100 kcal
- Carbs: 420g
- Protein: 70g
- Fat: 10g
- Total dough weight: 960g
After baking:
- Cooled loaf weight: 800g
- Calories per gram: 2,100 ÷ 800 = 2.625 cal/g
- For a 50g slice: 50 × 2.625 = 131 calories
Reading Sourdough Labels Accurately
One challenge with tracking sourdough macros is that commercial sourdough products vary enormously. Many store-bought “sourdoughs” are not true long-fermented sourdoughs — they’re made with added vinegar for flavor and don’t have the same macro benefits from genuine fermentation. These imitation sourdoughs will have higher sugar content and won’t provide the same glycemic benefits.
When reading labels, look for:
- Short ingredient lists: Flour, water, salt, and starter (or culture) are the only real ingredients needed
- Low or zero added sugars: Genuine sourdough should have under 1g of sugar per slice
- No added oils or fats: Traditional sourdough contains essentially no fat
- No preservatives or dough conditioners: These indicate commercial processing, not genuine fermentation
The macros on a genuine artisan sourdough label will typically show very low sugar and fat content, distinguishing it clearly from mass-market alternatives.
Common Sourdough Brands: Macro Comparison
| Brand | Slice Size | Calories | Carbs | Protein | Fat | Authentic? |
|---|---|---|---|---|---|---|
| Artisan Bakery (typical) | 50-60g | 130-150 | 25-28g | 4-6g | 0.5-1g | ✅ Yes |
| Trader Joe’s Sourdough | 45g | 120 | 23g | 4g | 1g | ⚠️ Partial |
| Panera Sourdough | 48g | 130 | 26g | 5g | 1g | ⚠️ Partial |
| Whole Foods 365 Sourdough | 50g | 140 | 27g | 5g | 1.5g | ❌ No (has oil) |