Bulk fermentation timing depends on multiple variables—temperature, starter percentage, hydration, and flour type—which makes it hard to remember all the adjustments mid-bake. This printable chart consolidates the timing ranges, visual cues, and troubleshooting steps from the full bulk fermentation guide into a single-page reference you can keep on your counter or tape inside a cabinet door.
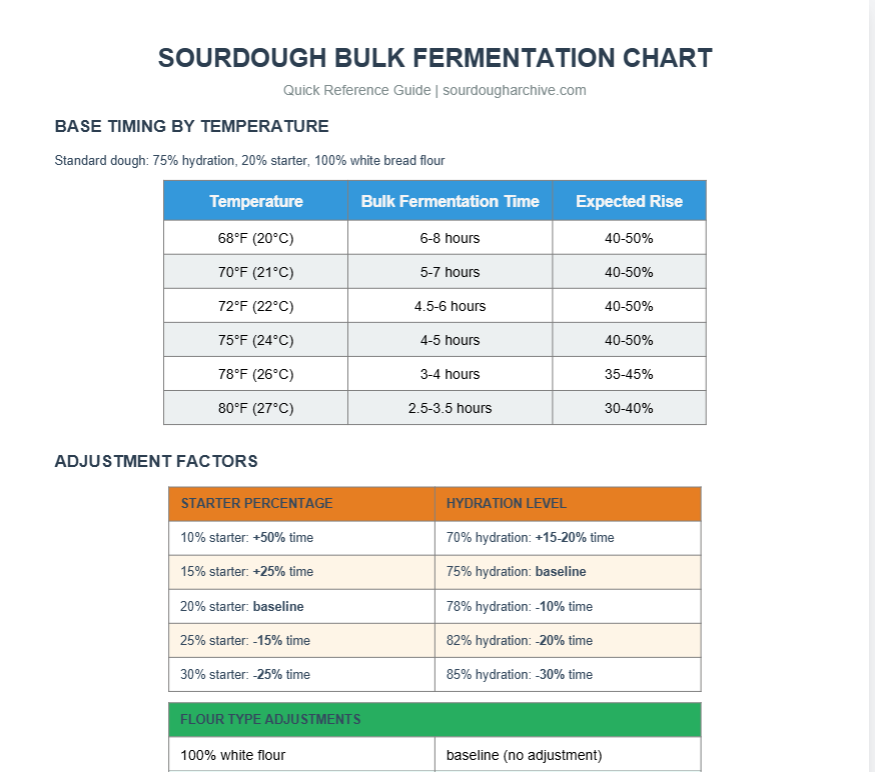
You’ll get temperature-based timing matrices, starter percentage adjustments, hydration modifiers, and a visual cue checklist that works for any sourdough recipe. No more pulling up your phone with sticky dough hands or trying to remember whether 75°F means 4 hours or 5 hours for your specific dough.
What’s Included in the Printable Chart
The printable chart is organized into five sections: base timing by temperature, starter percentage adjustments, hydration modifiers, flour type adjustments, and visual cue checklist. Each section is designed to be scannable in 5-10 seconds so you can quickly find the information you need without reading paragraphs of explanation.
Base Timing by Temperature
This is the core matrix showing bulk fermentation time ranges for standard dough (75% hydration, 20% starter, 100% white bread flour) at common room temperatures:
- 68°F: 6-8 hours
- 70°F: 5-7 hours
- 72°F: 4.5-6 hours
- 75°F: 4-5 hours
- 78°F: 3-4 hours
- 80°F: 2.5-3.5 hours
These times assume you’re starting with ripe starter at peak activity. If your starter is sluggish or past peak, add 1-2 hours to these ranges. For detailed temperature-specific guidance, see the 70°F chart, 75°F chart, or 80°F chart.
Starter Percentage Adjustments
The base timing assumes 20% starter (the most common percentage in sourdough recipes). If your recipe uses a different starter percentage, apply these multipliers:
- 10% starter: Add 50% to base time (e.g., 4 hours becomes 6 hours)
- 15% starter: Add 25% to base time (e.g., 4 hours becomes 5 hours)
- 20% starter: Use base time as-is
- 25% starter: Subtract 15% from base time (e.g., 4 hours becomes 3.4 hours)
- 30% starter: Subtract 25% from base time (e.g., 4 hours becomes 3 hours)
Use the bulk fermentation time calculator for precise calculations with unusual starter percentages.
Hydration Modifiers
The base timing assumes 75% hydration. Higher hydration dough ferments faster because water improves microbial mobility. Apply these adjustments:
- 70% hydration: Add 15-20% to base time
- 75% hydration: Use base time as-is
- 78% hydration: Subtract 10% from base time
- 82% hydration: Subtract 20% from base time
- 85% hydration: Subtract 30% from base time
For detailed guidance on high hydration bulk fermentation, see the dedicated chart for 78-85%+ hydration dough.
Flour Type Adjustments
The base timing assumes 100% white bread flour. Whole wheat and specialty flours ferment faster due to increased enzyme activity:
- 100% white flour: Use base time as-is
- 25% whole wheat: Subtract 10% from base time
- 50% whole wheat: Subtract 25% from base time
- 75% whole wheat: Subtract 35% from base time
- 100% whole wheat: Subtract 40-50% from base time
For detailed timing on whole wheat bulk fermentation, see the dedicated chart for 50-100% whole wheat dough.
Visual Cue Checklist
Use this checklist to confirm bulk fermentation is complete, regardless of timing. All four criteria should be met:
- Volume: Dough has risen 30-50% (mark your container at start)
- Surface: Domed top with visible bubbles just under the skin
- Jiggle test: Dough wobbles like set jello when you shake the container
- Poke test: Dough springs back slowly halfway when you press it with a wet finger
If you’re unsure about reading these cues, see visual signs bulk fermentation is done or the beginner’s chart for detailed explanations.
How to Use the Printable Chart
Start with the base timing for your current room temperature. Then apply adjustments in order: starter percentage first, then hydration, then flour type. Each adjustment compounds, so a 50% whole wheat dough at 82% hydration with 15% starter would subtract 25% for whole wheat, subtract 20% for hydration, and add 25% for starter percentage.
Example calculation: Base time at 75°F is 4-5 hours. Subtract 25% for 50% whole wheat = 3-3.75 hours. Subtract 20% for 82% hydration = 2.4-3 hours. Add 25% for 15% starter = 3-3.75 hours. Final range: 3-3.75 hours.
This seems complicated written out, but the chart organizes it visually so you can scan across rows and columns to find your adjusted time in seconds. The math is already done for common combinations.
When to Check Your Dough
Set a timer for 30 minutes before the lower end of your calculated range. Check visual cues at that point. If the dough isn’t ready, check again every 20-30 minutes until all four visual criteria are met. Don’t wait until the upper end of the range to check—you might overshoot.
Bulk fermentation has a window, not a fixed endpoint. A dough that’s ready at 4 hours might still be acceptable at 4.5 hours, but it will be overproofed at 5 hours. Check early and catch it in the sweet spot rather than waiting too long and dealing with overproofed dough.
Printing and Laminating Tips
Print the chart on standard 8.5×11″ paper. Use landscape orientation for better readability. The chart is designed to fit on one page without scaling, but if your printer cuts off edges, reduce to 95% size in your print settings.
Laminate the chart or slide it into a clear sheet protector to protect it from flour dust and dough splatter. Keep it somewhere visible but out of the way—inside a cabinet door, on the side of your refrigerator with a magnet, or tucked into a recipe binder. You want it accessible but not taking up prime counter space.
If you don’t have a laminator, use clear packing tape to cover both sides of the chart. It’s not as durable as lamination but works well enough and costs nothing if you already have tape on hand.
Chart Limitations and When to Use the Full Guides
The printable chart is a quick reference, not a comprehensive guide. It covers the most common scenarios—standard white flour dough, moderate hydration, room temperature fermentation—but it doesn’t cover every edge case or provide detailed troubleshooting.
Use the full guides when you’re dealing with unusual situations: extremely cold kitchens (below 68°F), very warm kitchens (above 82°F), mixed flour blends with multiple whole grains, or overnight cold bulk fermentation in the refrigerator. The chart assumes room temperature fermentation and doesn’t include timing for refrigerated bulk.
If your dough consistently finishes earlier or later than the chart predicts, your flour might have different enzyme activity than average, or your starter might be more or less vigorous than standard. Track your actual timing over 3-5 bakes and create personal adjustments. Pencil notes directly on the laminated chart with a dry-erase marker.
Common Scenarios with the Chart
Scenario 1: Standard White Flour Dough
Your recipe uses 100% bread flour, 75% hydration, and 20% starter. Your kitchen is 72°F. Look at the base timing row for 72°F: 4.5-6 hours. No adjustments needed since all variables match the baseline. Set your timer to check at 4 hours, and expect the dough to be ready between 4.5-6 hours.
Scenario 2: High Hydration White Flour
Your recipe uses 100% bread flour, 82% hydration, and 20% starter. Your kitchen is 75°F. Base timing at 75°F: 4-5 hours. Apply hydration adjustment for 82%: subtract 20% = 3.2-4 hours. Set your timer to check at 2.5 hours, and expect the dough to be ready between 3-4 hours.
Scenario 3: Whole Wheat Blend
Your recipe uses 50% bread flour and 50% whole wheat, 75% hydration, and 20% starter. Your kitchen is 75°F. Base timing at 75°F: 4-5 hours. Apply flour adjustment for 50% whole wheat: subtract 25% = 3-3.75 hours. Set your timer to check at 2.5 hours, and expect the dough to be ready between 3-3.75 hours.
Scenario 4: Lower Starter Percentage
Your recipe uses 100% bread flour, 75% hydration, and 15% starter. Your kitchen is 75°F. Base timing at 75°F: 4-5 hours. Apply starter adjustment for 15%: add 25% = 5-6.25 hours. Set your timer to check at 4.5 hours, and expect the dough to be ready between 5-6.25 hours.
Tracking Your Bakes
Keep a simple log on the back of your printed chart or in a notebook. Note the date, recipe specs (flour type, hydration, starter percentage), room temperature, actual bulk fermentation time, and whether the loaf was underproofed, perfectly proofed, or overproofed.
After 5-10 bakes, you’ll see patterns. Maybe your dough consistently finishes 30 minutes earlier than the chart predicts. That’s your personal adjustment factor—write “-30 min” on your chart and apply it going forward. Your flour brand, water source, and starter create a unique fermentation environment that might differ slightly from the averages in the chart.
If you’re getting inconsistent results, focus on dough temperature first. Room temperature tells you part of the story, but dough temperature is what actually matters. Use an instant-read thermometer to measure dough temperature right after mixing. If your dough is 78°F but your room is 72°F, use the 78°F timing row.
Troubleshooting with the Chart
Dough Finished Too Fast
If your dough consistently finishes 1-2 hours earlier than the chart predicts, your room temperature might be higher than you think, or your starter is exceptionally vigorous. Measure room temperature at dough level (not at eye level—warm air rises). Consider reducing your starter percentage by 5% to extend your window.
Dough Didn’t Rise Enough
If your dough shows minimal rise even at the upper end of the time range, your starter is weak or your room is too cold. Test your starter’s readiness by dropping a spoonful in water—it should float. If it doesn’t, you need to strengthen your starter before baking. See why bulk fermentation is slow.
Dough Collapsed During Shaping
You overproofed. The dough hit peak fermentation and you missed it. Next time, check 30-45 minutes earlier. Bulk fermentation has a narrow optimal window—once the dough is ready, you have 15-30 minutes before it tips into overproofing. Set earlier check-in times. Learn how to save overproofed dough.
Inconsistent Results
If your bulk fermentation time varies wildly between bakes (3 hours one day, 6 hours the next), temperature is fluctuating more than you realize. Use a proofing box to stabilize temperature, or move your dough to a consistently warm or cool spot in your house. Inconsistent temperature is the number one cause of unpredictable bulk fermentation.
Seasonal Adjustments
Your kitchen temperature probably varies by season. In summer, your room might run 78-82°F. In winter, it might drop to 68-70°F. Update which row of the chart you reference based on the season, and expect your bulk fermentation window to shift by 1-3 hours between seasons.
Some bakers keep two versions of the chart—one for warm weather and one for cold weather—with personal timing adjustments noted on each. This saves you from doing mental math every time the seasons change. If your winter kitchen is particularly cold, see the winter sourdough guide for tips on keeping dough warm.
Combining the Chart with Other Methods
The printable chart gives you timing estimates, but it works best when combined with hands-on observation. Use the timing as a starting point, then rely on visual cues to make the final call. Some bakers also use the aliquot method for precise rise tracking—take a small sample of dough in a narrow jar and track its rise percentage.
The poke test is particularly useful when combined with the chart. If your chart says 4-5 hours but the poke test shows the dough isn’t ready at 5 hours, trust the poke test. The chart provides guidance, not gospel.
Advanced: Creating Your Own Custom Chart
After you’ve used the printable chart for 20-30 bakes and tracked your results, you might want to create a custom chart based on your specific flour, starter, and environment. Use a spreadsheet to build your own timing matrix with your personal adjustment factors baked in.
Include the recipes you bake most often—your standard white loaf, your whole wheat blend, your high hydration ciabatta—and note the exact timing ranges you’ve observed for each at different temperatures. This becomes your personal reference that’s more accurate than any generic chart because it’s based on your actual results.
What the Chart Doesn’t Cover
The printable chart doesn’t include guidance on stretch-and-fold schedules, autolyse timing, or when to move from bulk fermentation to shaping. It also doesn’t cover the difference between bulk fermentation and final proofing.
For comprehensive guidance on the full sourdough process, see how to make sourdough bread or the beginner’s recipe. The chart is one tool in your sourdough toolkit—helpful for quick timing checks but not a replacement for understanding the underlying process.
Downloading and Printing the Chart
The printable chart is available as a free PDF download. Click the download button below to get the single-page reference chart. No email signup required—just download and print.
The PDF is formatted for US Letter size (8.5×11″) but will also print correctly on A4 paper with minor scaling. If you’re outside the US, your printer should automatically adjust the margins. If text appears cut off, reduce the print size to 95% in your printer settings.
Quick Reference Summary
Here’s the fastest way to use the chart: Find your temperature, apply adjustments for starter/hydration/flour, set a timer for 30 minutes before the low end of your range, check visual cues, and shape when all four criteria are met. That’s it.
If you forget the adjustments or don’t have time to calculate, just use the base timing for your temperature and rely heavily on visual cues. The timing ranges are wide enough that you’ll catch the dough somewhere in the window even without precise adjustments. Visual cues (jiggle test, poke test, domed surface, bubbles) are more reliable than any timing chart because they respond to your actual dough, not theoretical averages.
For more bulk fermentation resources, see: